From Other Worlds to Inner Worlds: Why Astronomy Belongs in Human Brain Mapping
Mars, Andromeda, the Pillars of Creation, and Orion may seem far removed from the human brain. Yet the images through which we know them are built by many of the same intellectual and computational disciplines used to map neural structure and function.
What are we actually seeing when we look at an image of Mars, the Andromeda Galaxy, the Pillars of Creation, or the Orion Nebula?
The immediate answer is obvious: a planet, a galaxy, and regions in which stars are being formed. The more important answer is that we are looking at measurements translated into images. Each apparently seamless picture is the final product of instruments, acquisition conditions, calibration, alignment, filtering, integration, reconstruction, color assignment, and interpretation. Its beauty is real, but so is the methodological labor behind it.
The same is true of human brain maps.
An EEG trace is not a neuron speaking directly. A magnetoencephalography map is not a photograph of thought. A functional MRI image does not show neuronal activity itself; it represents physiological changes associated with it. A connectivity map is not a set of anatomical wires laid bare. In each case, a hidden biological process is inferred from an indirect signal. The final map becomes meaningful only through the quality and transparency of the path that produced it.
This is where astronomy and human brain mapping meet. They are both sciences of inference under conditions of distance: physical distance in one case, and biological and measurement distance in the other.
Mars: The Familiar Object That Still Changes With the Measurement
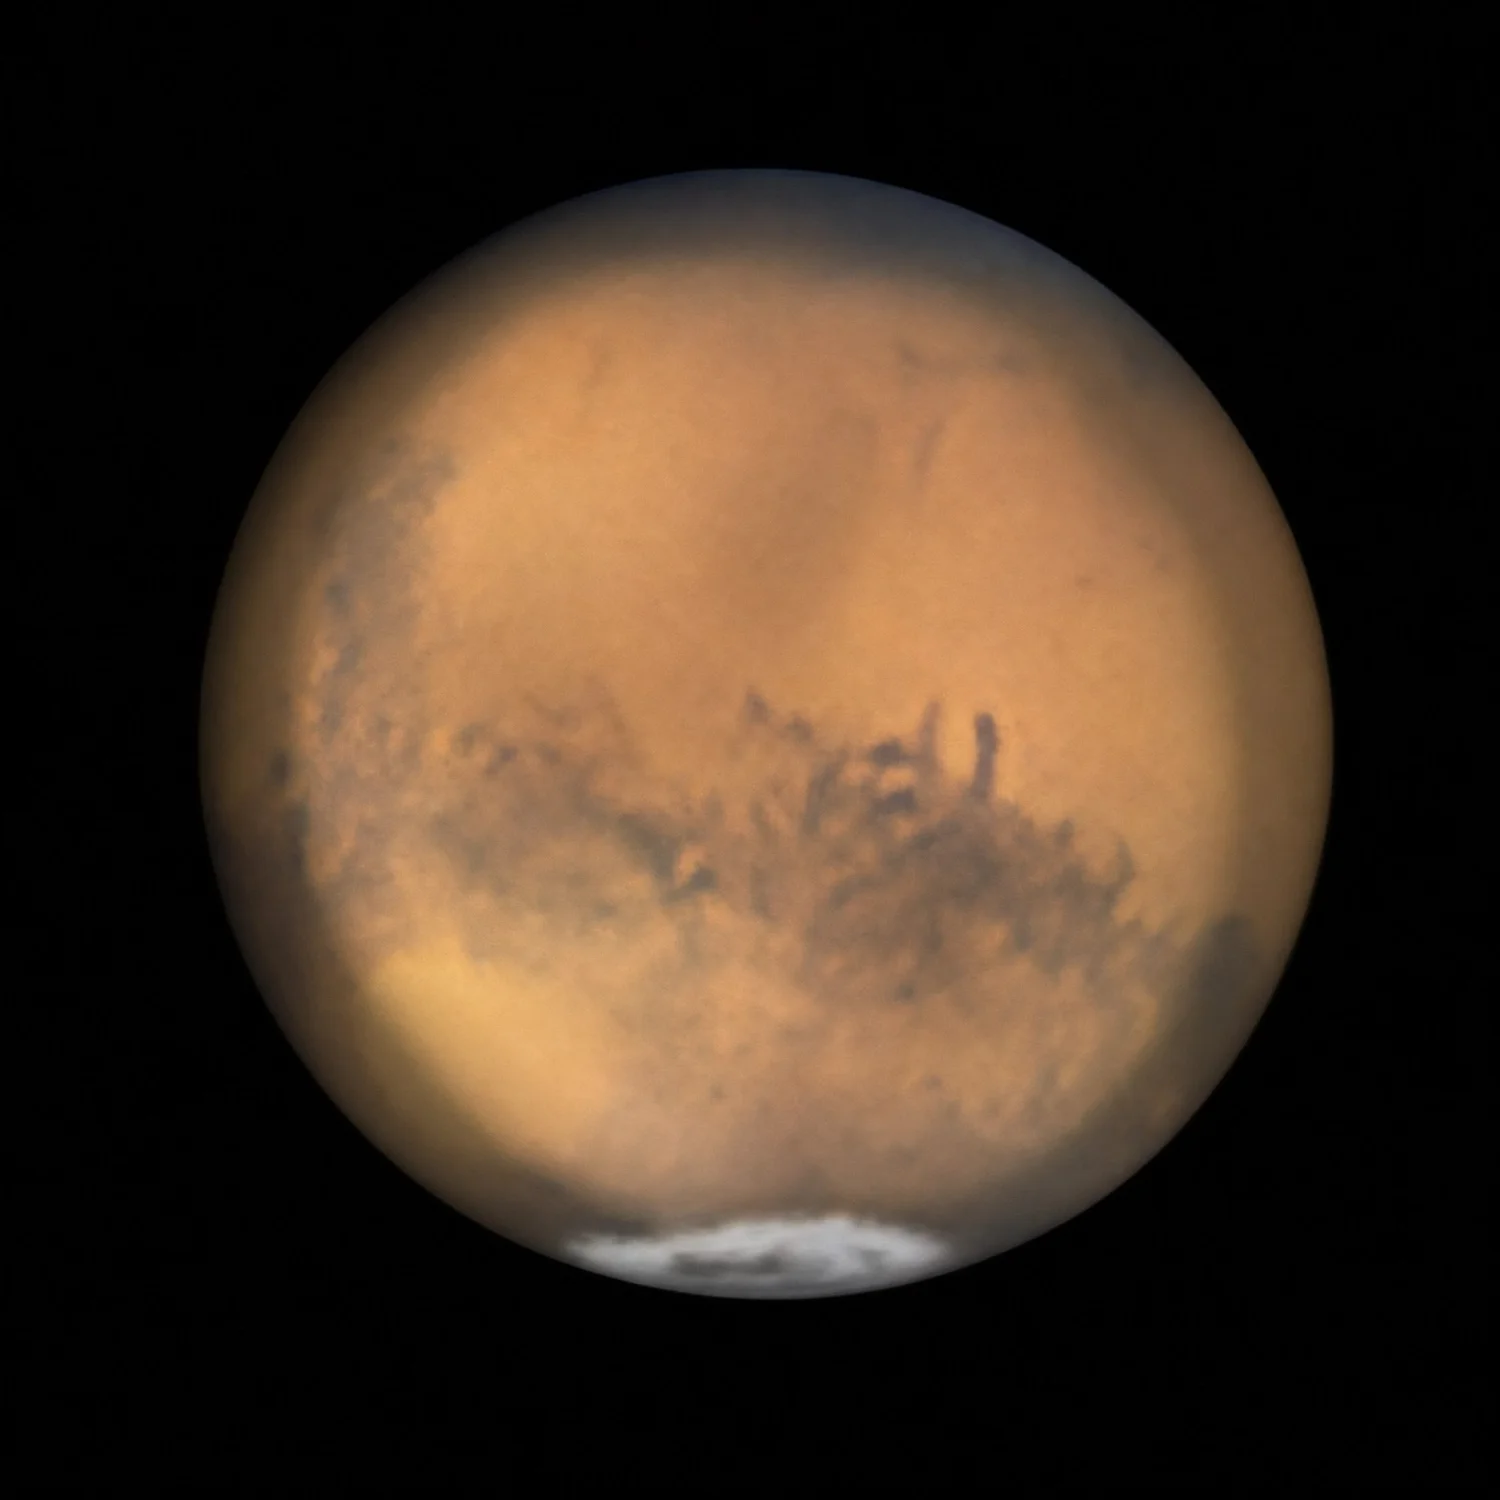
Mars is comparatively near, familiar, and recognizable. Yet even Mars does not present a single, fixed appearance. NASA’s Hubble observations across several decades show differences associated with seasons, viewing geometry, polar ice, clouds, dust storms, and successive generations of cameras. Orbiters, landers, rovers, and telescopes observe the same planet from different positions and through different instruments, each contributing a distinct form of evidence.
A clear planetary image therefore does not eliminate the measurement problem; it makes that problem easy to overlook. Atmospheric turbulence, optical alignment, sensor response, exposure, motion, frame selection, and image processing all influence what becomes visible. Repeated observations help determine which features belong to the planet, which reflect a temporary planetary state, and which arise from the observing system.
The parallel with brain mapping is immediate. A person’s neural signals vary with sleep, attention, medication, movement, disease state, and the task being performed. Recordings also vary with electrode placement, scanner characteristics, environmental noise, preprocessing choices, and the physiological quantity being measured. A finding that appears in one session or one modality may be important, but reproducibility across time, states, and instruments makes it more trustworthy.
Mars therefore offers the first lesson: proximity is not the same as direct access. Even when an object appears familiar, a reliable map requires repeated measurement, calibration, and careful separation of the object from the conditions under which it was observed.
Andromeda: A Unified Image Built From Many Pieces
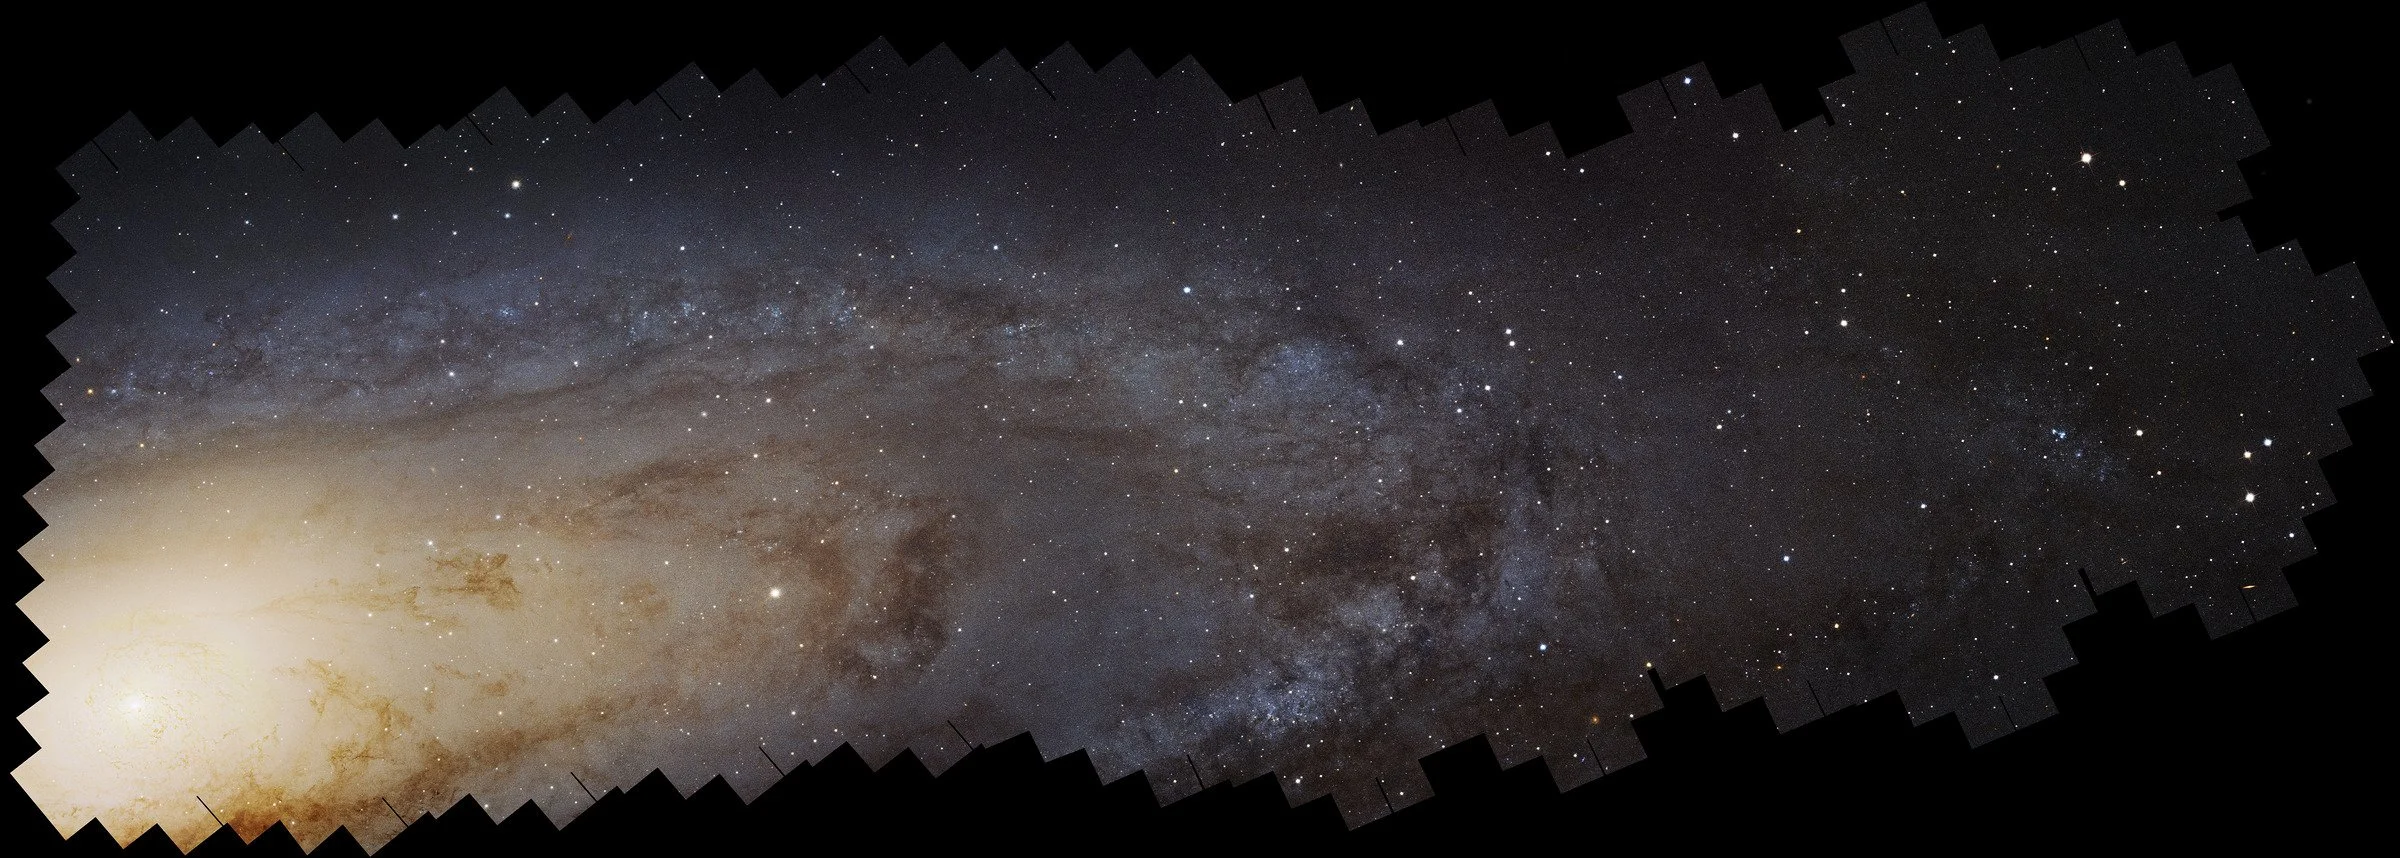
The panoramic Hubble view of the Andromeda Galaxy looks like a single, continuous portrait. It is not. NASA describes it as a mosaic assembled from approximately 600 overlapping fields observed over more than a decade. The resulting image contains at least 2.5 billion pixels and resolves an estimated 200 million stars.
Andromeda makes the hidden architecture of image construction visible. Individual observations must be calibrated, spatially registered, corrected, and stitched together. Overlapping regions must agree. Differences in exposure and background must be reconciled. A coherent whole emerges only after numerous partial views have been placed into a shared geometry.
Human brain mapping faces the same problem at several scales. An individual electrode samples only a limited region. A scan captures one person in one state at one time. A group atlas requires brains of different shapes and sizes to be aligned to a common space. Longitudinal studies must determine whether an apparent change reflects biology, motion, instrumentation, or the registration process itself.
Like the Andromeda mosaic, a brain atlas is not simply collected; it is assembled. Its apparent continuity can conceal boundaries between measurements, uncertainties in alignment, and regions that were sampled more densely than others. This does not make the final map artificial or untrustworthy. It means that trust depends on whether the assembly process is visible, reproducible, and appropriately validated.
Andromeda therefore provides the second lesson: a unified map may be constructed from many incomplete observations. The scientific question is not whether a map was processed—it inevitably was—but whether the processing preserved the structures that matter.
The Pillars of Creation: Different Instruments Reveal Different Realities
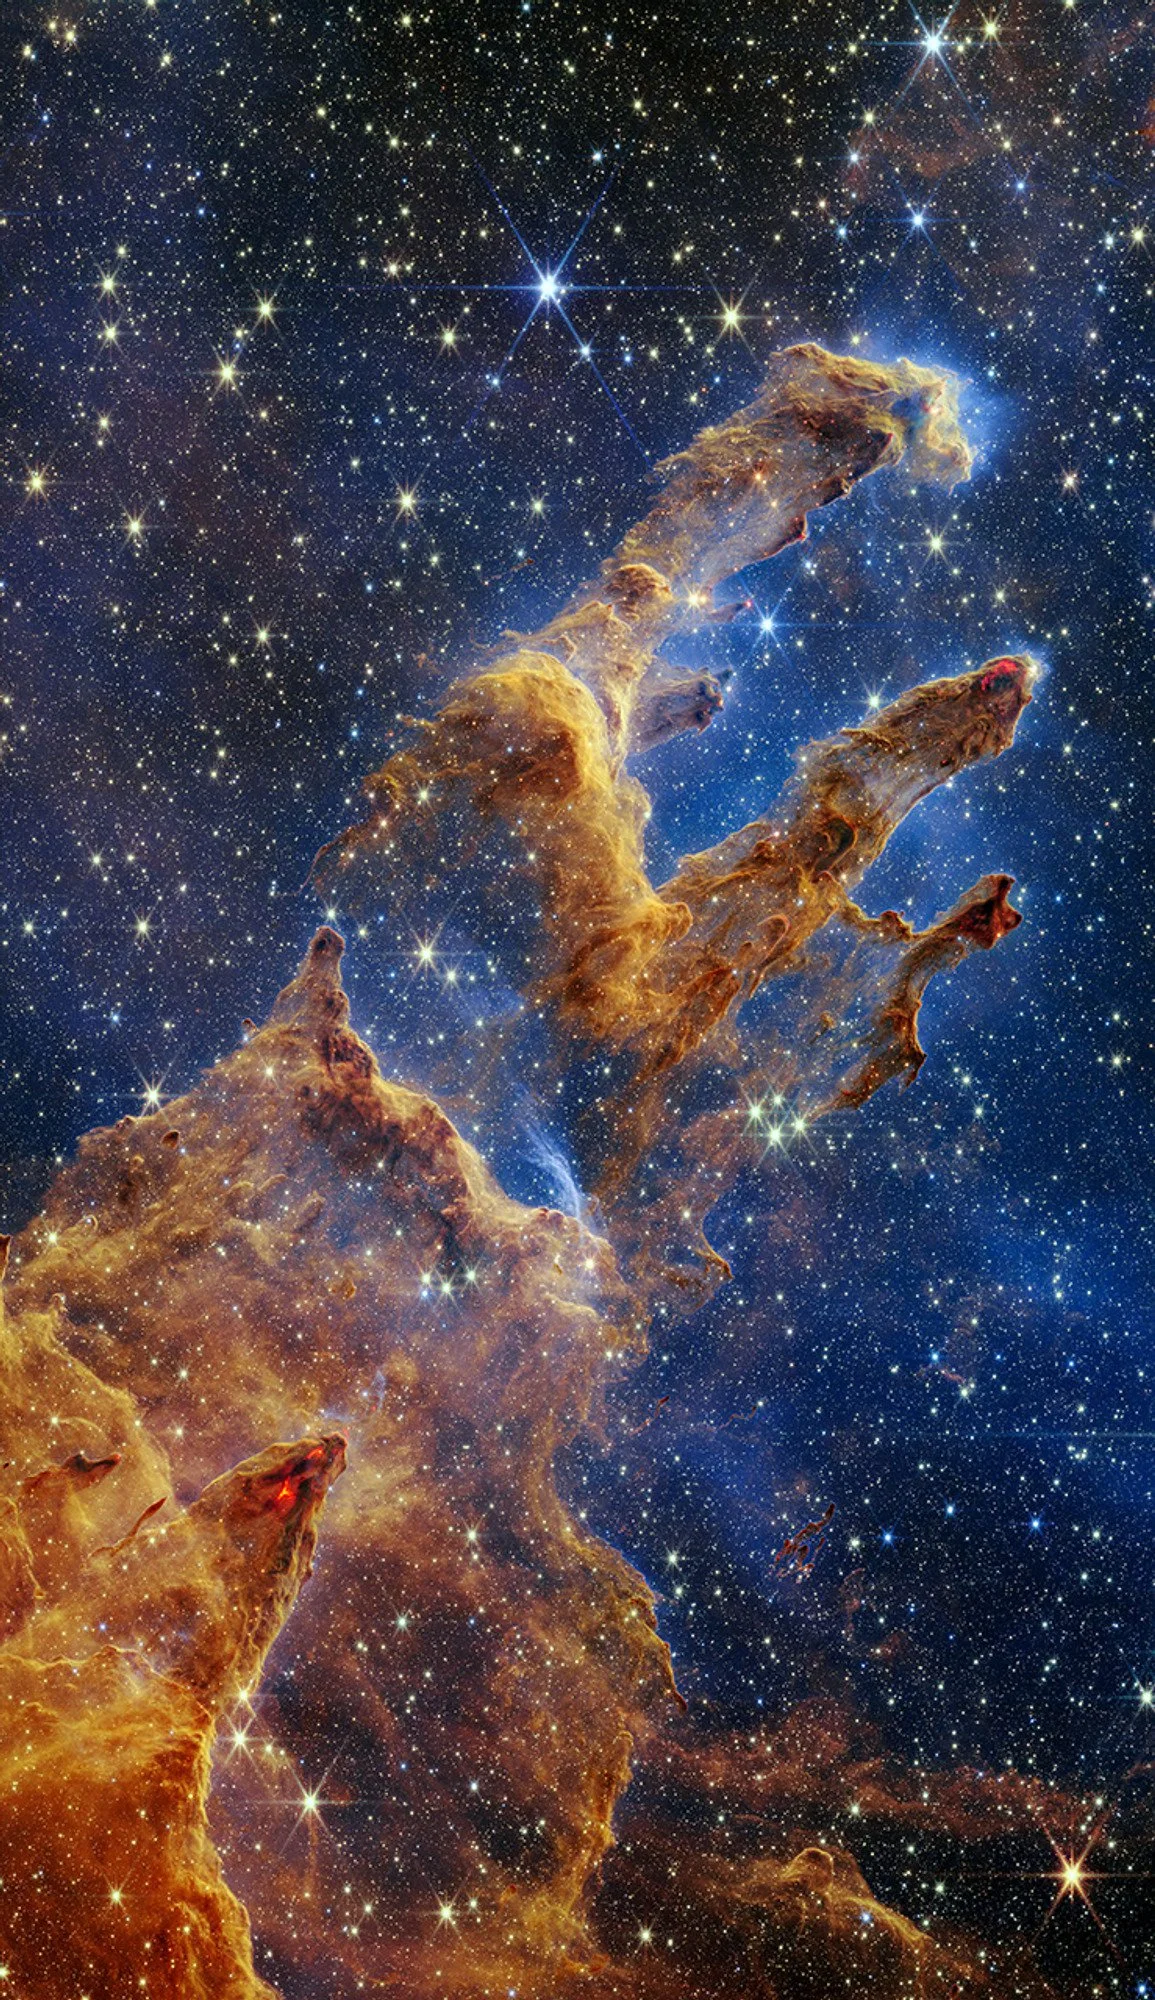
The Pillars of Creation provide one of the clearest demonstrations that there is no single, instrument-independent view of nature. In Hubble’s visible-light view, dense dust forms a dramatic dark silhouette. In Webb’s near-infrared view shown here, much of that dust becomes semi-transparent, revealing newly formed stars within and behind the cloud. Neither image is the uniquely correct one. Each records a different interaction between matter, wavelength, and instrument.
This is precisely how brain-mapping modalities relate to one another. Structural MRI emphasizes anatomy. Functional MRI tracks hemodynamic changes associated with neural activity. EEG and MEG measure electrical and magnetic consequences of neuronal currents with high temporal resolution. Intracranial recordings sample local field activity more directly but only where electrodes have been placed. Stimulation introduces yet another form of evidence by testing how the nervous system responds to perturbation.
These modalities should not be expected to produce identical maps, because they do not measure identical phenomena. Their disagreements may reveal limitations, but they may also reveal complementary layers of organization. Just as infrared light can disclose stars hidden in a visible-light image, one brain-mapping method may expose activity or structure that another method cannot detect.
The colors in these images also require intellectual discipline. In astronomy, color may represent wavelengths beyond normal human vision. In brain mapping, color may encode voltage, power, blood-oxygen change, statistical confidence, connectivity strength, or model output. Color makes invisible quantities perceptible, but it can also create an illusion of directness. The color is not the phenomenon itself; it is a visual language used to represent a measurement.
The Pillars therefore offer the third lesson: what becomes visible depends on how we choose to measure it. Multimodal disagreement is not always a flaw to be eliminated. Sometimes it is the evidence that the system has more than one layer.
Orion: Fusion Can Reveal Structure That No Single View Contains
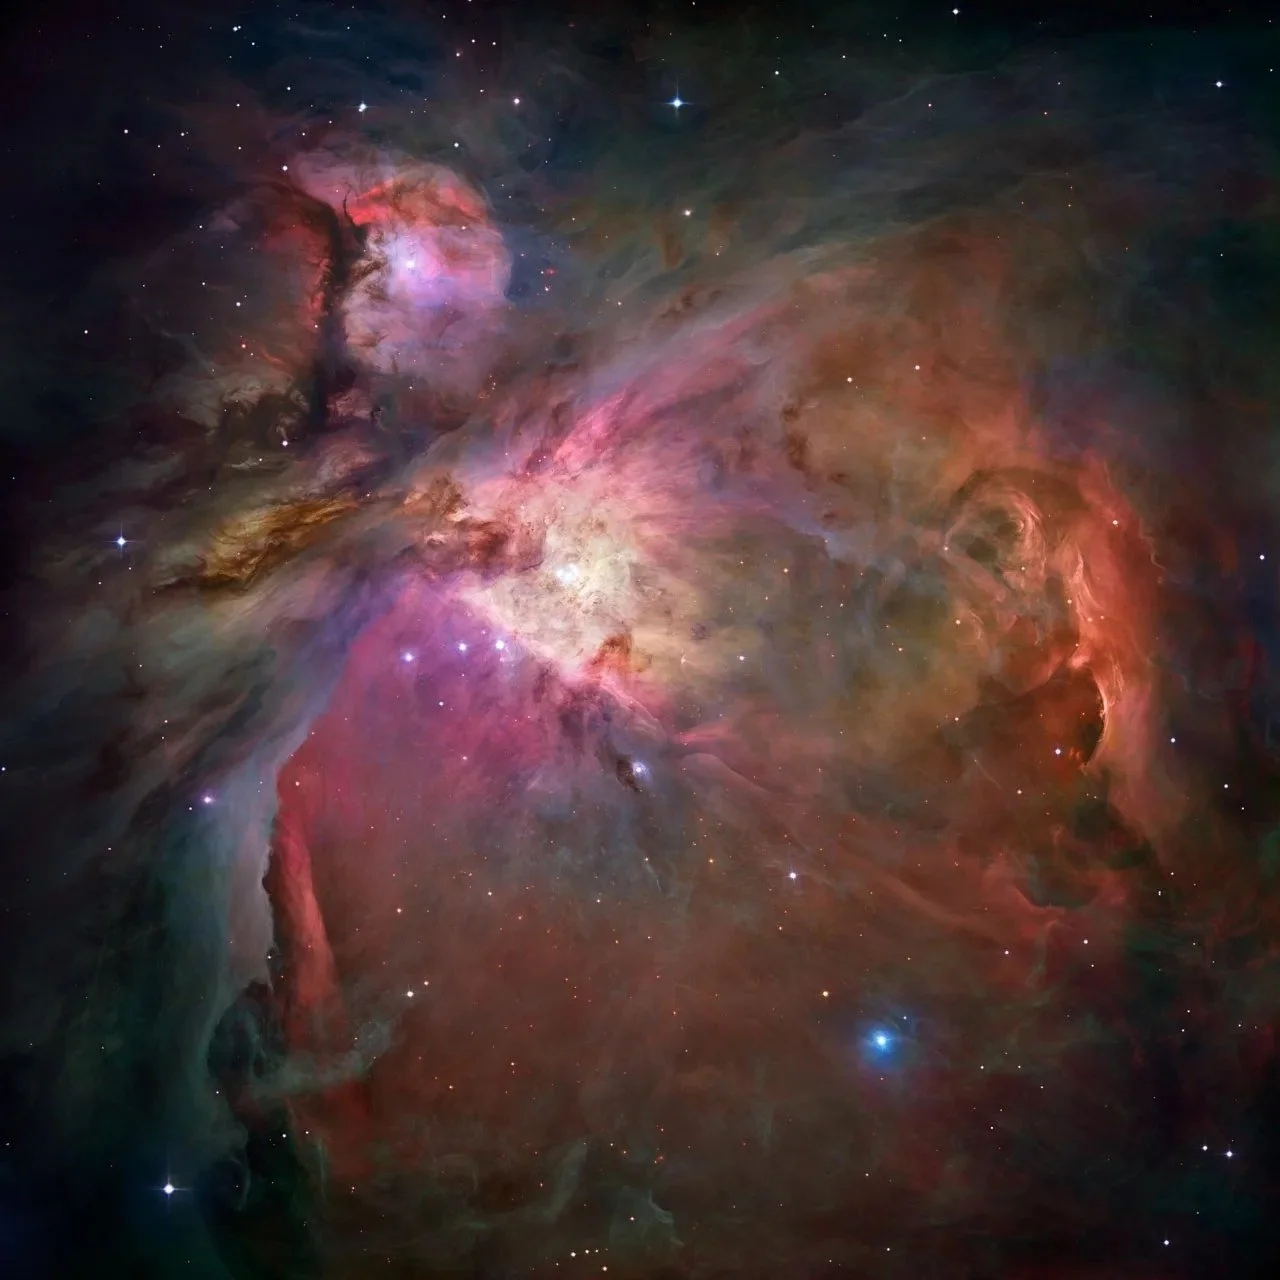
The Orion Nebula extends this principle from comparison to integration. The Hubble image shown here is a mosaic assembled from 520 exposures obtained through five filters. In a related NASA visualization, visible-light observations from Hubble are combined with infrared observations from Spitzer. Warm gas, hydrocarbon dust, young stars, shadows, and cavities contribute differently to each view; together, the measurements provide clues to the nebula’s complex three-dimensional organization, in which depth is inferred rather than directly observed.
The combined view is not valuable because it makes two instruments agree perfectly. It is valuable because each instrument constrains the interpretation of the other. Visible light supplies information that infrared lacks, and infrared penetrates structures that visible light cannot. Fusion produces a richer inference than either modality could support alone.
This is also the ambition of multimodal human brain mapping. Anatomy can constrain electrophysiological source estimates. EEG and MEG can add temporal precision to hemodynamic maps. Stimulation can test whether a predicted functional region is clinically consequential. Behavior can determine whether a physiological change corresponds to a meaningful human experience or ability. The strongest map is often not the one produced by the most sophisticated instrument, but the one in which independent forms of evidence converge without concealing their differences.
Orion therefore supplies the fourth lesson: integration should preserve complementarity. Multimodal fusion is not the averaging away of disagreement. It is the disciplined use of distinct measurements to narrow the range of plausible explanations.
A Shared Methodological Language
Across these examples, astronomy and human brain mapping converge on a common set of practices.
| Shared discipline | In astronomy | In human brain mapping |
|---|---|---|
| Calibration | Separates detector and optical behavior from the incoming signal. | Separates amplifier, scanner, electrode, and environmental effects from physiological activity. |
| Registration | Aligns exposures, fields, epochs, and wavelengths to a common geometry. | Aligns sessions, modalities, electrodes, anatomy, and individuals to a common space. |
| Artifact control | Addresses atmosphere, tracking, cosmic rays, glare, and sensor noise. | Addresses motion, muscle, cardiac, device, line-noise, and scanner artifacts. |
| Integration | Stacks exposures and combines telescopes or wavelength bands. | Combines repeated trials and integrates EEG, MEG, MRI, fMRI, stimulation, and behavior. |
| Inverse reasoning | Infers the properties and locations of sources from received radiation. | Infers neural sources and networks from fields, signals, and physiological responses. |
| Visualization | Maps intensity or wavelength into visible form. | Maps physiology, statistics, or connectivity into color and geometry. |
| Validation | Tests consistency across instruments, epochs, and physical models. | Tests reproducibility across methods, sessions, patients, centers, and clinical outcomes. |
| Uncertainty | Quantifies confidence in a feature through signal-to-noise estimates, error ranges, and agreement across observations. | Quantifies confidence through intervals, posterior distributions, stability analyses, and replication across models or datasets. |
The table reveals why the comparison is more than metaphor. The objects are different, but the epistemic work is strikingly similar. Both fields transform incomplete signals into claims about structures that cannot be inspected directly. Both depend on models. Both can be seduced by beautiful visualizations. Both become stronger when the full path from acquisition to inference is open to examination.
Related Methodological Frontiers
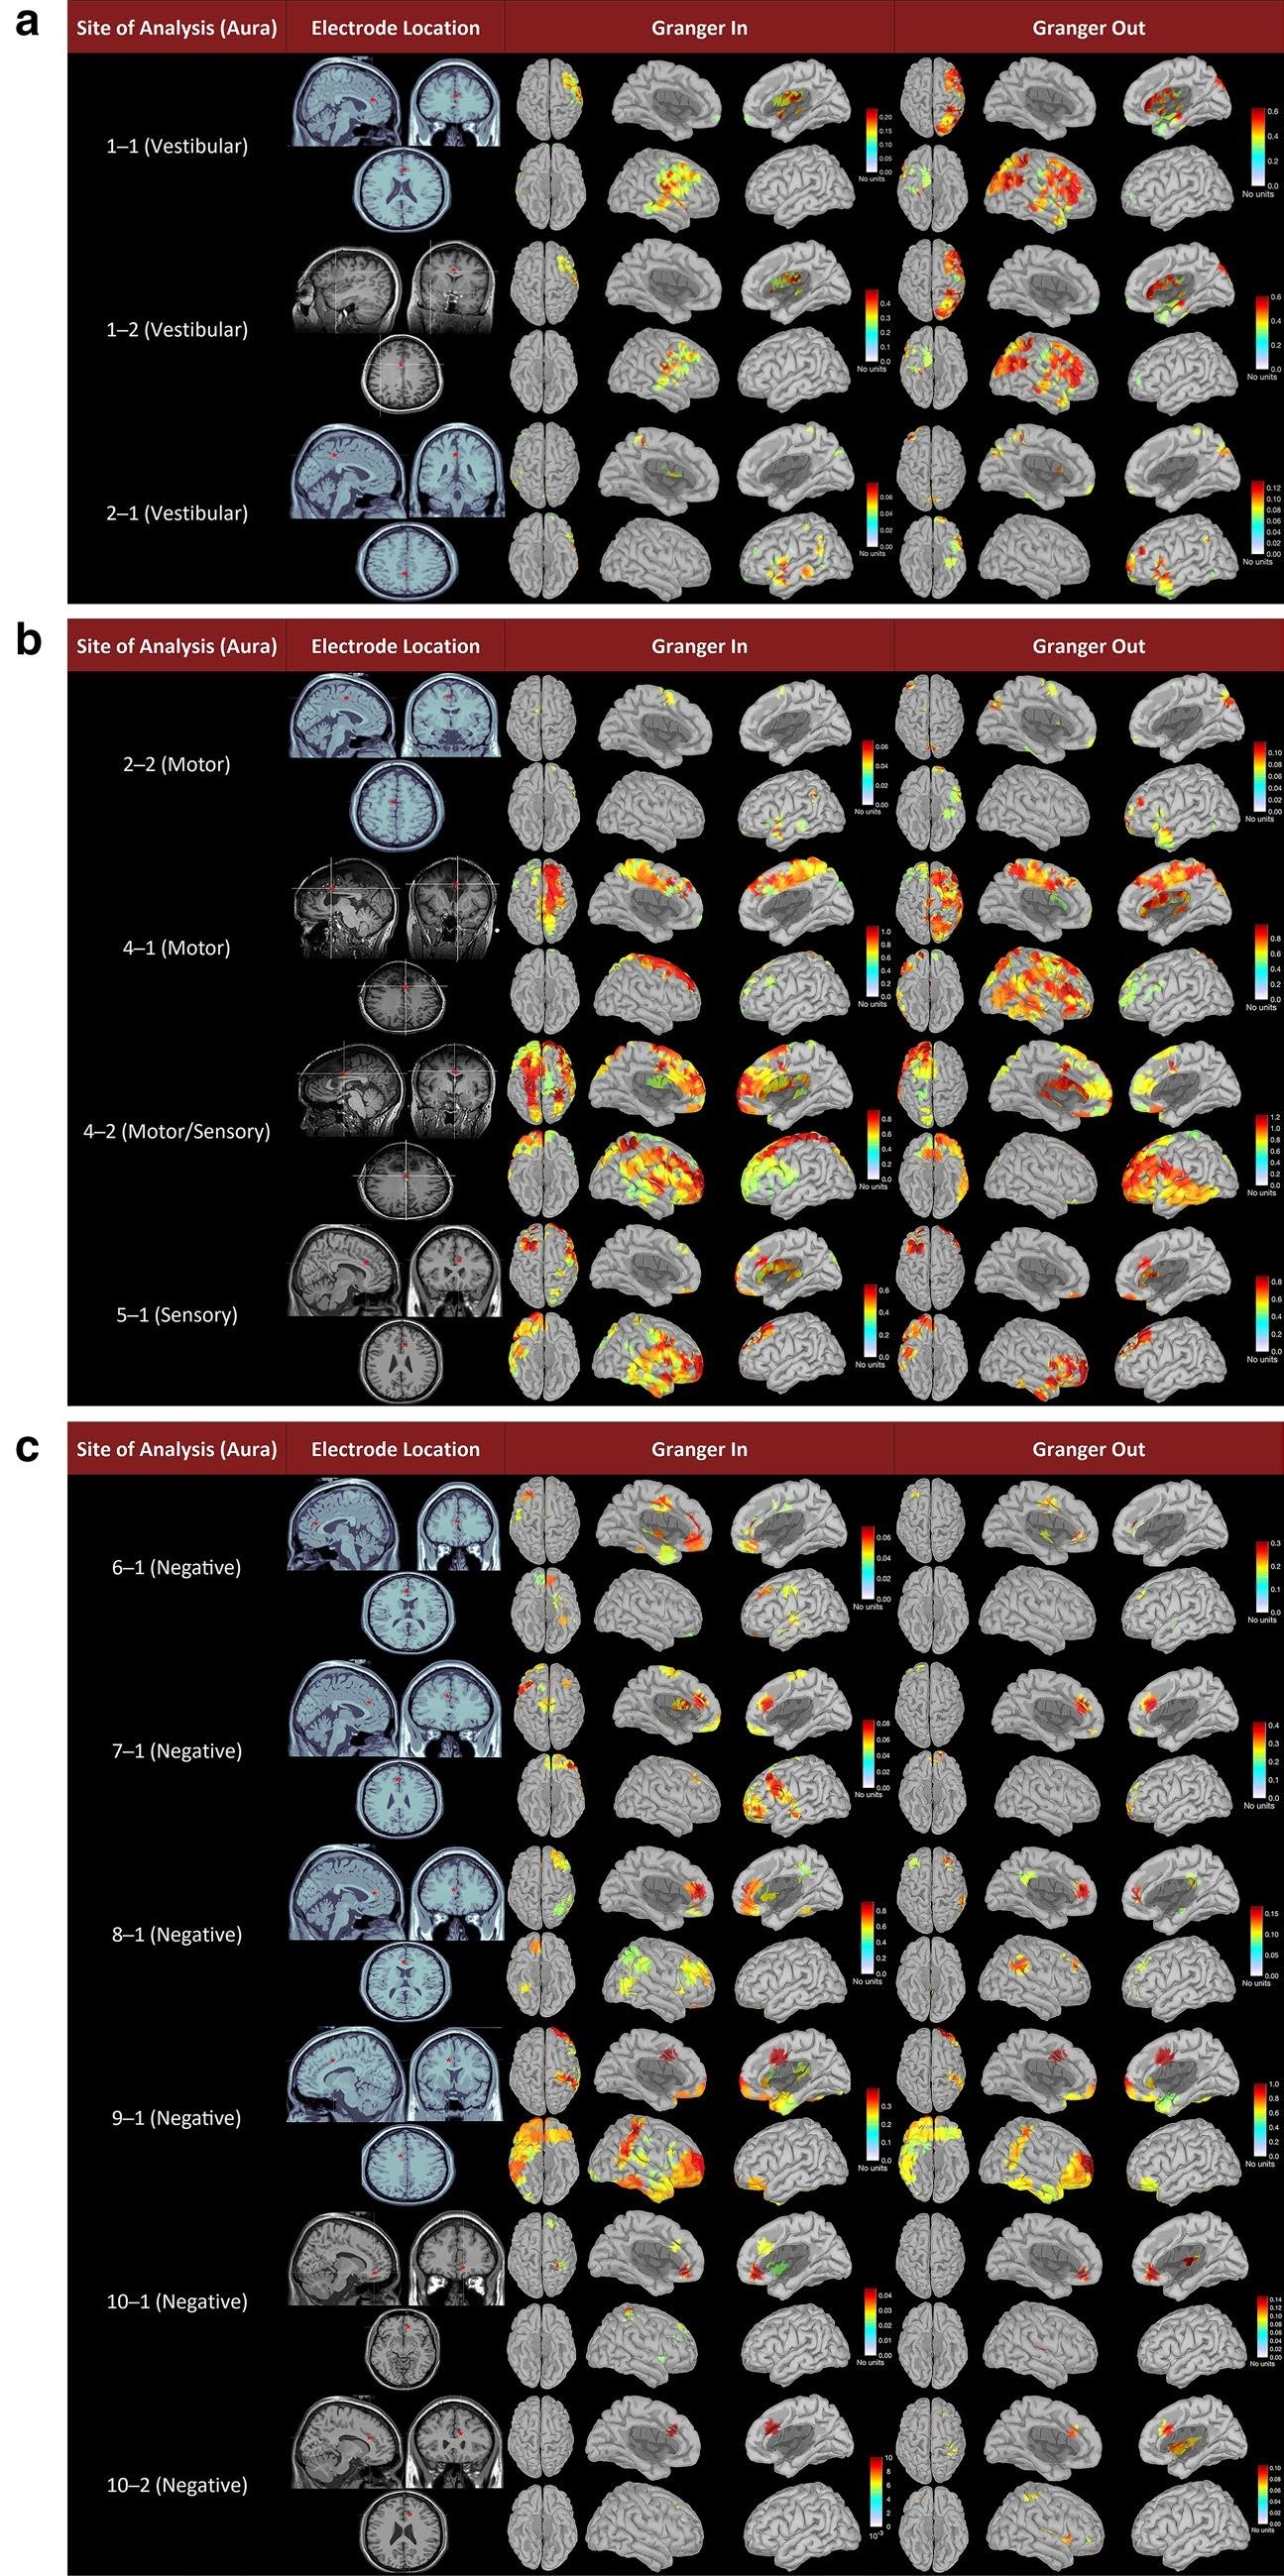
This same discipline runs through our work in intracranial EEG and brain–computer interfaces, methodological innovation in MEG, and the clinically responsible use of AI. Each frontier asks how a measurement becomes a trustworthy and useful inference rather than merely an impressive output.
Where the Analogy Ends
The comparison must also retain its limits. A galaxy does not change because it has been measured. The human brain can adapt, learn, compensate, and respond to stimulation. Neural measurements are also embedded in individual lives and clinical decisions. Errors can affect diagnosis, surgery, treatment, identity, autonomy, and privacy.
There is also an important mathematical asymmetry. Direct imaging generally fixes an astronomical source’s angular position on the sky from the incoming radiation, whereas the EEG and MEG inverse problem is non-unique: multiple—and without constraints, infinitely many—source configurations can produce the same sensor-level fields. A usable neural source estimate emerges only after anatomical, biophysical, and mathematical constraints are imposed; those constraints are part of the inference, not neutral scaffolding.
For those reasons, brain mapping requires all the methodological care of astronomy plus additional ethical and clinical accountability. A technically elegant map may still be clinically irrelevant. A statistically reproducible difference may not matter to an individual patient. A model may be accurate on average yet unreliable for the population or decision in which it is used.
Recognizing these differences strengthens the analogy rather than weakening it. Astronomy offers a model of disciplined reconstruction; medicine adds the obligation to connect that reconstruction to human meaning and consequence.
Why Astronomy Belongs Here
Astronomy belongs on a Human Brain Mapping site because it sharpens the central question of mapping: How do we responsibly represent what we cannot observe directly?
Together, these four objects remind us that a map is neither a raw fact nor a mere artistic product. It is a scientific argument made visible.
That principle is as important when looking inward as when looking outward. The value of an astronomical image on a human brain-mapping site is therefore not decorative. It asks readers to pause before the apparent immediacy of any image—celestial or neural—and consider the instruments, assumptions, transformations, and uncertainties that stand between signal and sight.
Different objects, same discipline: do not mistake a beautiful reconstruction for direct reality. Make the pipeline visible, allow independent measurements to challenge one another, and ask which structures remain when the method changes.
Astronomy does not sit at the edge of human brain mapping. Methodologically, it stands beside it.
References and Image Sources
- NASA Scientific Visualization Studio: Hubble Observations of the Red Planet
- NASA Scientific Visualization Studio: 2018 Mars Global Dust Storm
- NASA Science: Hubble Traces the Hidden History of the Andromeda Galaxy
- NASA Science: Pillars of Creation—Webb NIRCam Image
- NASA Science: Pillars of Creation in Visible and Near-Infrared—Hubble Comparison
- NASA Scientific Visualization Studio: Pillars of Creation: M16
- NASA Science: Hubble M42 Orion Nebula Mosaic
- NASA Scientific Visualization Studio: The Orion Nebula: Visible and Infrared Views
- NASA/JPL: Hubble and Spitzer 3-D Journey Through the Orion Nebula
- Plute, Spencer, and Alkawadri: Age-Dependent Vestibular Cingulate–Cerebral Network Underlying Gravitational Perception: A Cross-Sectional Multimodal Study — Brain Informatics (2022), 9:30